 GeoData.NZ
DRILLING PLATFORMS
Type of resources
Available actions
Topics
Keywords
Contact for the resource
Provided by
Years
Update frequencies
status
-
This data publication contains biostratigraphic age events for the CIROS-1 drill core, updated age ranges for a suite of samples from the McMurdo erratics sample collection, age-depth tie points for CIROS-1, CRP-2/2A, DSDP 270, DSDP 274, ANDRILL 2A and ANDRILL 1B, and glycerol dialkyl glycerol tetraethers (GDGTs) abundances and indices for samples from the McMurdo erratics, CIROS-1, CRP-2/2A, DSDP 270, DSDP 274, ANDRILL 2A, and ANDRILL 1B. All sample sites are in the Ross Sea region of Antarctica. The McMurdo erratics are glacial erratics collected in the McMurdo Sound region between 1991 and 1996 (Harwood and Levy, 2000). The CIROS-1 drill core was collected from McMurdo sound in 1986 with samples spanning the upper Eocene to lower Miocene. CRP-2/2A drill core was collected in 1999 from offshore Victoria Land with samples for this study from the upper Oligocene-lower Miocene. DSDP Site 270 was recovered from the Eastern Basin of the central Ross Sea in 1973, with samples spanning the upper Oligocene-lower Miocene. DSDP Site 274 was drilled on the lower continental rise in the northwestern Ross Sea in 1973, and samples for this study have been taken from the middle Miocene sections of the drill core. The ANDRILL-2A core was recovered in 2007 from Southern McMurdo Sound, samples span the lower Miocene to middle Miocene and data was originally published in Levy et al. (2016). The ANDRILL-IB core was drilled from the McMurdo Ice Shelf in 2006, samples are compiled from the Plio-Pleistocene section of the core and were originally published in McKay et al. (2012). Biostratigraphic age events are described for CIROS-1, expanding on and updating previously published age models and biostratigraphic ranges. Ages are also revised for the McMurdo erratics by updating the ages of the biostratigraphic markers described by (Harwood and Levy (2000) to more recently published age ranges. Age models for the sample sites are developed using published age datums and the Bayesian age-depth modelling functionality in the R package Bchron (Haslett and Parnell, 2008) to ensure a consistent approach for assigning ages to core depths between datums. GDGT abundances and indices for Ross Sea sites are presented to reconstruct ocean temperatures over the Cenozoic era. Detailed methodology for the processing and analysis of samples for GDGTs is described in the methods section of supplement paper.
-
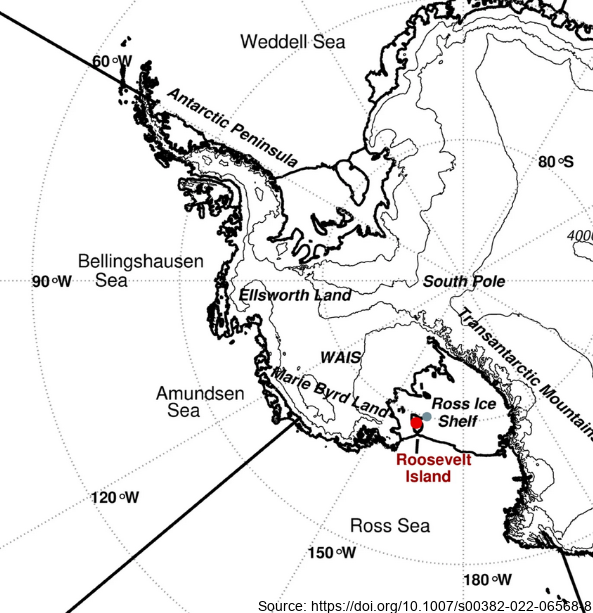
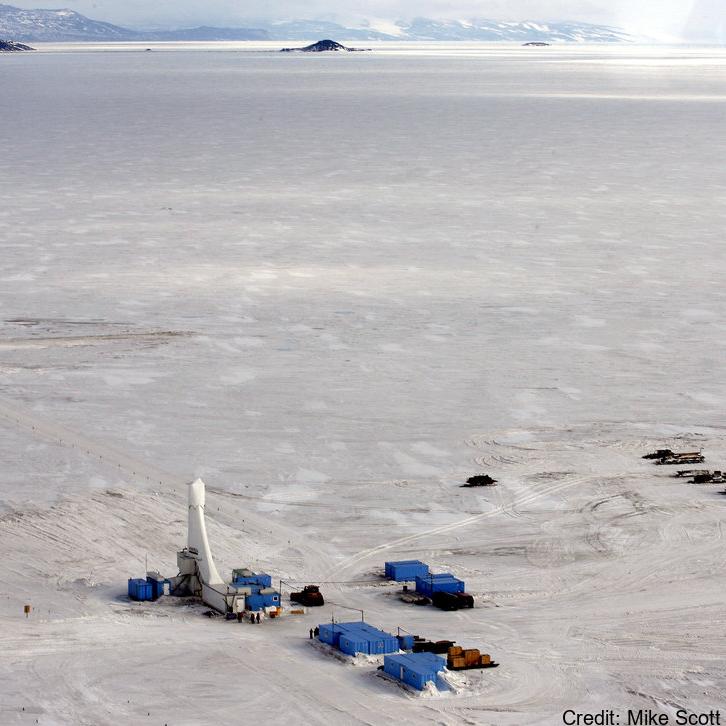
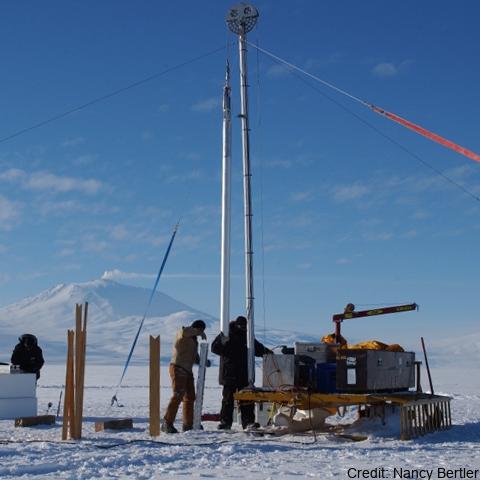
Here we examine the water stable-isotope data from the Roosevelt Island Climate Evolution (RICE) ice core. In this study, we use empirical orthogonal function (EOF) analysis to investigate the relationship between RICE ice-core oxygen-18 isotopes (δ18O) and Southern Hemisphere atmospheric circulation during the extended austral winter (April–November). - Deep Location: 79.364°S, 161.706°W, elevation 550 m a.s.l. - 12/13B Location: 79.362°S, 161.698°W, elevation 550 m a.s.l. - Core depth 763 m. Depth interval provided here: 1.29 to 38.56 m - txt data file, NaN = no data Further details are available at https://doi.org/10.1007/s00382-022-06568-8 GET DATA: https://github.com/demanuelsson/ClimDyn_2022_Matlab/tree/main/data
-
Here, we present a decadally resolved record of sea-salt sodium (a proxy for open-ocean area) and non-sea salt calcium (a proxy for continental dust) from the well-dated Roosevelt Island Climate Evolution (RICE) core, focusing on the time period between 40–26 ka BP. Drilling site coordinates: (79.364° S, 161.706°W). Further collection details can be found at https://doi.org/10.1038/s41467-023-40951-1
-
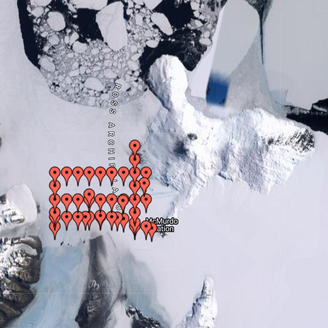
The thicknesses of sea ice and sub-ice platelet layer were measured at regular intervals on fast ice in McMurdo Sound, Antarctica in November and December of 2011. Thirty-metre cross-profiles were established at each site, and snow depths were measured at 0.5 m intervals along the transect lines with a metal ruler. A mean snow depth for each site was derived from these 120 measurements. Freeboard, sea ice thickness and sub-ice platelet layer thickness were recorded at five locations at each site - at the central crossing point and at the end points of each transect. The mean of these was then calculated and taken as representative of the site. Ice thicknesses were measured by using a tape measure with a brass T-anchor attached at the zero mark. This was deployed vertically through the drill-hole and allowed to rotate to a horizontal alignment when exiting the bottom of the drill-hole at the ice-ocean interface. From this position the anchor is slowly pulled upwards until some resistance is met and the first measurement is taken. This resistance is taken to mark the sub-ice platelet layer/ocean interface. The tape measure is then pulled harder, forcing the bar to pass through the sub-ice platelet layer until it sits flush against the sea ice/sub-ice platelet layer interface where a second measurement is taken. Measurement sites were about 5 km apart.
-
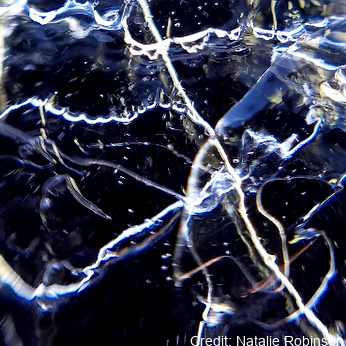
Here, we present drill hole measurements carried out at 14 field sites distributed over a ~1500 km^2 area of fast ice in the south of McMurdo Sound, Antarctica between 1 and 19 November 2018. At each site, five holes were drilled in the fast ice at the centre and end points of two cross‐profile lines, each 30 metre long. Sea ice and SIPL thicknesses were measured with a suspended thickness probe and metal bar using the procedure described in Price et al. (2014). Snow depth measurements at centimetre accuracy were made at half‐metre intervals along the cross‐profiles using a metal ruler or a GPS‐equipped Magnaprobe. Sea ice freeboard (i.e., the height of the sea ice surface above sea level) was measured in each of the drill holes. The average value for each parameter was calculated at each field site to provide a representative measurement over the 30 metre cross-profile fast ice area. The drill hole measurements were used to underpin spatial distribution surveys of the aforementioned parameters, to inform electromagnetic induction forward and inverse models, and to ground-validate satellite altimetry assessments of fast ice freeboard and derived ice thickness in McMurdo Sound.
-

Sea ice thickness and sub-ice platelet layer thickness under fast ice were measured at regular intervals at two North-South oriented profiles and four east-west oriented profiles in McMurdo Sound, Antarctica in November 2013. Holes were drilled at regular intervals into sea ice at measurement sites about 10 km apart. The thickness was measured using measurement tapes. Snow depth on sea ice was also measured at all sites
-
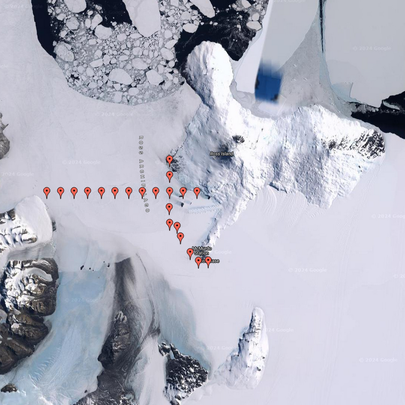
Sea ice thickness and sub-ice platelet layer thickness under sea ice was measured in regular intervals. Holes were drilled into sea ice at measurement sites about 5 km apart. The thickness was measured using measurement tapes. Snow depth on sea ice was also measured at sites.
-

The thicknesses of sea ice and sub-ice platelet layer were measured at regular intervals on fast ice in McMurdo Sound, Antarctica in November of 2016. Thirty-metre cross-profiles were established at each site, and snow depths were measured at 0.5 m intervals along the transect lines with a MagnaProbe. A mean snow depth for each site was derived from these 120 measurements. Freeboard, sea ice thickness and sub-ice platelet layer thickness were recorded at five locations at each site - at the central crossing point and at the end points of each transect. The mean of these was then calculated and taken as representative of the site. Ice thicknesses were measured by using a tape measure with a brass T-anchor attached at the zero mark. This was deployed vertically through the drill-hole and allowed to rotate to a horizontal alignment when exiting the bottom of the drill-hole at the ice-ocean interface. From this position the anchor is slowly pulled upwards until some resistance is met and the first measurement is taken. This resistance is taken to mark the sub-ice platelet layer/ocean interface. The tape measure is then pulled harder, forcing the bar to pass through the sub-ice platelet layer until it sits flush against the sea ice/sub-ice platelet layer interface where a second measurement is taken. Measurement sites were about 10 km apart.
-

The thicknesses of sea ice and sub-ice platelet layer were measured at regular intervals on fast ice in McMurdo Sound, Antarctica in November of 2017. Thirty-metre cross-profiles were established at each site, and snow depths were measured at 0.5 m intervals along the transect lines with a MagnaProbe. A mean snow depth for each site was derived from these 120 measurements. Freeboard, sea ice thickness and sub-ice platelet layer thickness were recorded at five locations at each site - at the central crossing point and at the end points of each transect. The mean of these was then calculated and taken as representative of the site. Ice thicknesses were measured by using a tape measure with a brass T-anchor attached at the zero mark. This was deployed vertically through the drill-hole and allowed to rotate to a horizontal alignment when exiting the bottom of the drill-hole at the ice-ocean interface. From this position the anchor is slowly pulled upwards until some resistance is met and the first measurement is taken. This resistance is taken to mark the sub-ice platelet layer/ocean interface. The tape measure is then pulled harder, forcing the bar to pass through the sub-ice platelet layer until it sits flush against the sea ice/sub-ice platelet layer interface where a second measurement is taken. Measurement sites were about 10 km apart.